Norway has a well earned reputation for being a prosperous place. However, my research shows that its people are the most indebted in the world, as of 2025.
Methodology
Note: Feel free to cite or screenshot this page. Please cite “SQLpipe - a data engineering consultancy.”
Data pipeline
The charts in this post are “live” and refresh anytime the underlying data source, the Bank for International Settlements, updates their data. This data pipeline costs less than $0.05 per day to run. Learn more about how this data pipeline works here: Bank for International Settlements data pipeline case study.
Debt service ratio
There are many ways to measure debt, but my preferred instrument is the “debt service ratio”, which is the % of a given entity's gross disposable income that goes to debt payments. To give a simplified example, if your salary after taxes is $100,000 per year and your debt payments add up to $20,000 per year, you would have a debt service ratio of 0.2, or 20%.
Household debt service ratio
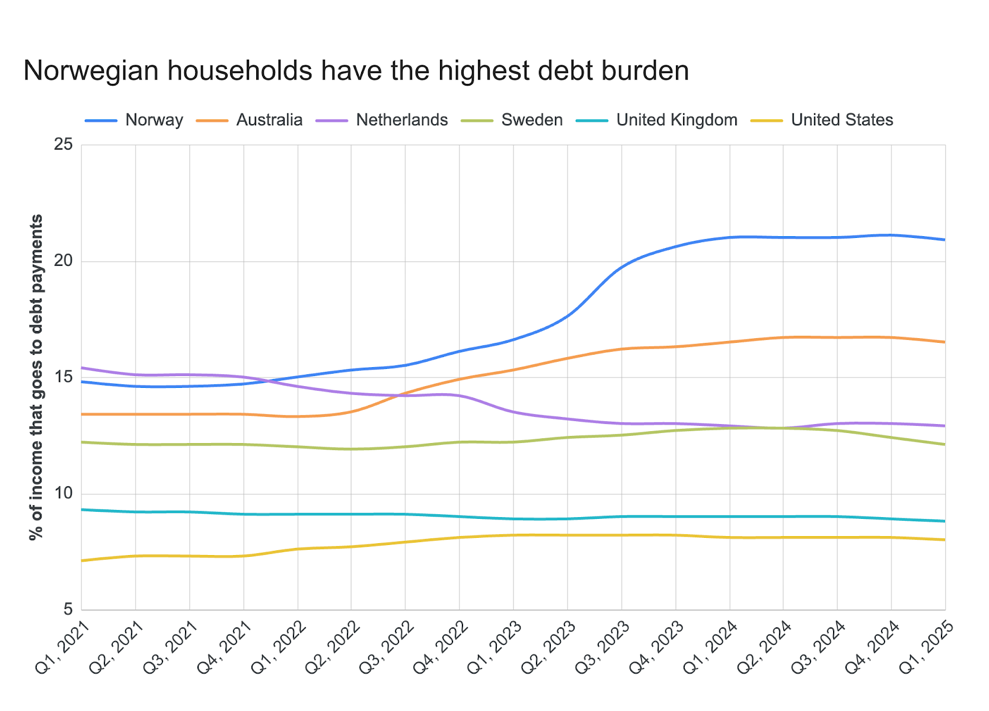
The chart below shows the household debt service ratio of Norway, compared to a few other advanced economies. You can change the countries shown on the chart with the filter control on the right.
As you can see, Norway has had a high household debt service ratio for some time, but it jumped in 2023. Australia has the second most indebted households in my dataset, and Sweden, the US, UK, and dataset average are included for context.
Usually, a household’s largest debt payment is for their home. I suspect the rise in debt service ratio in Norway was at least in part caused by:
- Norway’s mortgages typically have floating interest rates
- Norway’s central bank raised interest rates significantly around 2023
Central Bank Policy Rates
Here is a chart showing central bank policy rates for the countries shown above during the past 5 years:
As you can see, Norway’s central bank policy rate did rise, as did most other countries. What’s special about Norway, however, is that most of their mortgages are tied to NIBOR, which is an interest rate benchmark for interbank lending in Norway. This means that residential loans in Norway are particularly sensitive to the Norges Bank policy rate. I believe this explains why Norway’s households experienced a large rise in their debt service ratio, while other countries did not experience such a sharp rise.
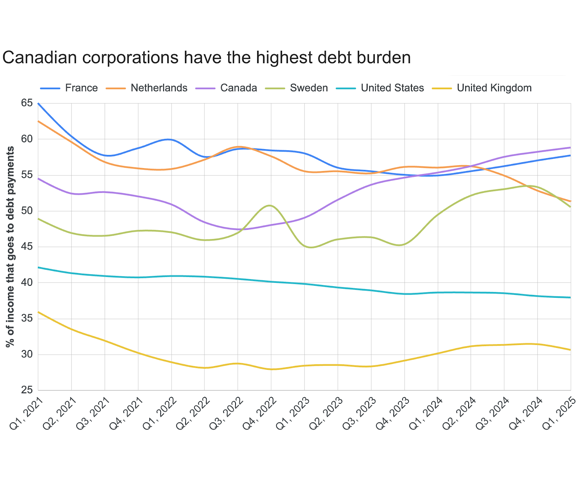
What about Norway’s corporations?
The chart below shows the debt service ratio of private, non financial corporations in Norway, compared to a few other advanced economies. It is important to exclude financial corporations, such as banks, because their core business involves high leverage and intermediating credit, so including them would double-count debt and distort our view of financial stress on the “real economy.”
France, Canada, and the Netherlands (not shown), and Sweden are the top 4 countries by this measurement. Norway is middle of the pack.
Combining the two ratios
We can combine household and non financial corporate debt service ratios to get the total debt service ratio of the non governmental sector.
Below is a chart showing the 4 countries with the highest total private debt service ratio, as well as the US and UK. Technically, Hong Kong has the highest ratio, but I find its economic situation to be linked to China in a way that distorts the ratio.
The chart shows that Norway’s recent surge in its household debt service ratio has pushed it to the top of rankings for “most indebted private sector”. I find it very interesting that numbers 1 - 4 on this list are all prosperous northern European countries.
Takeaways
Overall, this research highlights a paradox in Norway's economic standing: while the nation is broadly prosperous, its households bear the heaviest debt burden globally, as measured by the debt service ratio.
This sharp rise in household debt payments appears directly linked to the combination of Norway’s reliance on floating-rate mortgages tied to the NIBOR benchmark and the recent significant interest rate hikes by Norges Bank. Although Norway's corporate sector maintains a moderate debt profile, the dramatic increase in household debt has propelled the total private sector debt service ratio to the top of international rankings, a position shared with several other wealthy northern European economies.
This pattern suggests that, despite high national wealth, specific domestic financial structures can expose individual households to considerable financial stress during periods of monetary tightening.